

Most RevOps leaders inherit the 3x pipeline coverage rule without questioning where it came from. It sounds rigorous, it's easy to communicate upward, and it gives everyone a shared number to rally around. The problem: it's a relic of a different era of B2B sales, and applying it uniformly across your GTM motion is one of the fastest ways to misread your revenue health and underprepare for a miss.
The average B2B win rate across all opportunities sits at 21% in 2026 — and 29% for qualified opportunities. If your enterprise team closes 1 in 6 deals, telling them to hold 3x coverage means you're essentially planning to miss. The right coverage ratio isn't a rule of thumb. It's a calculation, and it varies meaningfully by segment, cycle length, and deal source.
Where the 3x Rule Came From — and Why It No Longer Applies
The 3x pipeline coverage benchmark emerged from inside sales models in the 1990s and early 2000s, when deals were transactional, cycles were short, and win rates were higher. At a 33% win rate, you genuinely do need roughly 3x coverage to hit quota. That math works.
But SaaS GTM motions in 2026 look nothing like that model. Average enterprise sales cycles now run 120–180 days. Buying committees have grown. Economic headwinds have extended deal scrutiny. Enterprise win rates have compressed to the 15–25% range for most mid-market and enterprise SaaS teams. At a 20% win rate, you need 5x coverage just to break even — and that's before accounting for late-stage slippage and pull-forward deals that close in the wrong quarter.
Meanwhile, the blanket 3x number obscures segmentation differences that matter enormously to forecast accuracy. A high-velocity SMB team closing 50–60% of qualified deals in a 30-day cycle has a fundamentally different pipeline math than an enterprise team running multi-stakeholder deals over six months. Treating both with the same coverage target creates false confidence in one segment and unnecessary pressure in the other.
The Right Formula: Calculate Coverage from Win Rate, Not Benchmarks
The cleanest way to set a coverage target is to work backwards from your historical win rate:
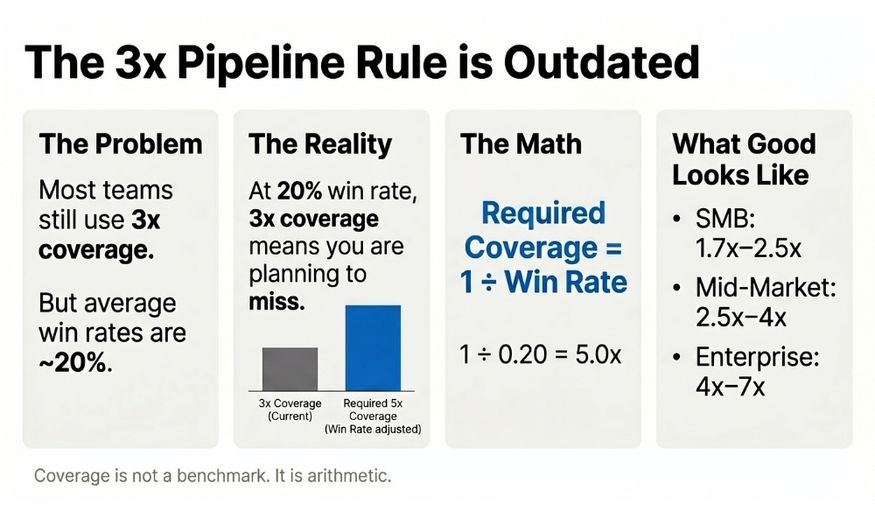
Required Coverage = 1 ÷ Win Rate
At a 25% win rate, you need 4x coverage. At 33%, you need 3x. At 17%, you need roughly 6x. This isn't a framework — it's arithmetic. The challenge is that most teams apply one win rate to a mixed pipeline instead of segmenting by motion.
The calculation should be done at the segment level, not the company level. At minimum, calculate separate coverage targets for:
- SMB / high-velocity (sub-30-day cycles, 50–60% win rates): Target 1.7–2.5x
- Mid-market (60–90-day cycles, 25–40% win rates): Target 2.5–4x
- Enterprise (120–180-day cycles, 15–25% win rates): Target 4–7x
Companies that secure Series B and beyond in 2026 are being evaluated not just on pipeline volume but on pipeline engine efficiency — the ability to convert predictably at each tier. Investors and boards are increasingly asking "What's your win rate by segment?" before they ask "What's your total pipeline?"
Pipeline Quality Matters as Much as Coverage Ratio
Even the right coverage number means nothing if the pipeline isn't clean. A common pattern: teams inflate their coverage ratio with deals that have stalled for 90+ days, carry no defined next step, and haven't had a stakeholder meeting in three weeks. On paper, 4x coverage. In practice, 1.5x of real opportunity.
Healthy pipeline coverage requires quality filters alongside the ratio. The most effective RevOps teams in 2026 are layering in signals like:
- Engagement recency: Has there been a meaningful touchpoint in the past 14 days?
- Stakeholder breadth: Is more than one buyer persona engaged, particularly for enterprise deals?
- MEDDIC or MEDDPICC qualification score: What's the completeness score on each qualifying dimension?
- Deal velocity: Is the deal moving at a pace consistent with the historical average for that segment?
Pipeline that fails these filters should be tagged separately — either as "at risk" or excluded from the primary coverage calculation. This gives leadership a realistic coverage view rather than a padded one.
AI-assisted pipeline intelligence tools are making this kind of filtering much more accessible. In 2026, top-performing RevOps teams are using AI co-pilots to flag stale deals, surface engagement gaps, and recalculate effective coverage in near real-time — reducing reliance on end-of-week inspection calls and manual CRM hygiene checks.
How to Build a Coverage Model That Actually Works
Building a coverage model that earns trust across sales leadership, finance, and the board requires a few structural decisions.
Segment your pipeline from day one. Don't let a single "total pipeline" number dominate your internal reporting. Set coverage targets by segment, report actuals against those targets, and flag any segment that drops below threshold in your weekly operating cadence.
Use two coverage numbers: gross and qualified. Gross coverage includes everything in the CRM above stage 1. Qualified coverage filters to deals with complete discovery, an identified budget, and a confirmed next step. The gap between these two numbers is your pipeline quality gap — and it's often larger than expected.
Set a coverage floor and a ceiling. Having too little pipeline is obviously dangerous. But obsessing over pipeline volume above a certain threshold produces diminishing returns and misdirects rep energy. For most teams, once coverage exceeds 6–7x even with quality filters applied, the marginal value of adding more top-of-funnel is lower than improving conversion rates mid-funnel.
Review coverage by source. Inbound-sourced deals typically close at higher rates than outbound. Partner-sourced deals often carry longer cycles. SDR-sourced enterprise pipeline has different velocity characteristics than AE-sourced or marketing-attributed. Understanding coverage by source lets you identify which channels are producing the most reliable revenue — not just the most volume.
Connecting Coverage to Forecast Accuracy
Pipeline coverage is a leading indicator. Forecast accuracy is the lagging one. If your coverage numbers look healthy but your forecasts keep missing, the problem is almost always one of three things: win rates are lower than assumed, sales cycles are longer than modeled, or the quality filter is too loose.
The RevOps function's job is to keep these two metrics in alignment. That means regularly recalibrating the win rate assumptions underlying your coverage targets — ideally on a rolling 90-day basis — and surfacing anomalies before they turn into a quarter-end miss.
Companies with a formal RevOps function report 36% higher revenue growth than those without one, according to research from ORM Technologies. That gap isn't attributable to one thing, but the ability to connect pipeline health metrics to forecast outcomes — and act on the signal early — is a consistent differentiator.
Conclusion
The 3x coverage rule had its day. In 2026, applying it uniformly across a segmented GTM motion is a liability, not a safeguard. The RevOps teams earning the most credibility with their boards are the ones who have done the math — segment by segment, source by source, win rate by win rate — and built coverage models that reflect how their business actually closes revenue.
If your current pipeline model still relies on a blanket multiple, it's worth a hard look before the next quarter starts. The right ratio for your team is calculable. The question is whether you've calculated it.
Ready to build a pipeline coverage model that reflects your actual GTM motion? Book a RevOps audit with Ryvr and get a clear view of where your coverage stands — and what it needs to be.

